Understanding Your Client Report
At Quantum Rise, transparency isn’t just a value—it’s a technical requirement. While our algorithmic strategies operate with high-tech precision, we believe the results of those strategies should be accessible and easy to navigate.
Your performance report (client report) tracks the evolution of your capital. But what do the individual line items actually tell you about your money?
This guide serves to act as a “legend” for your report, moving beyond the raw data to define exactly what each metric represents. By understanding these pillars, you can better appreciate the technical rigor and measurable results that define the Quantum Rise approach.
When you invest with Quantum Rise, you receive a detailed monthly performance report. At first glance, it can look like a lot of numbers — but every figure tells an important part of your investment story. Here’s what each section means and why it matters to you as an investor.
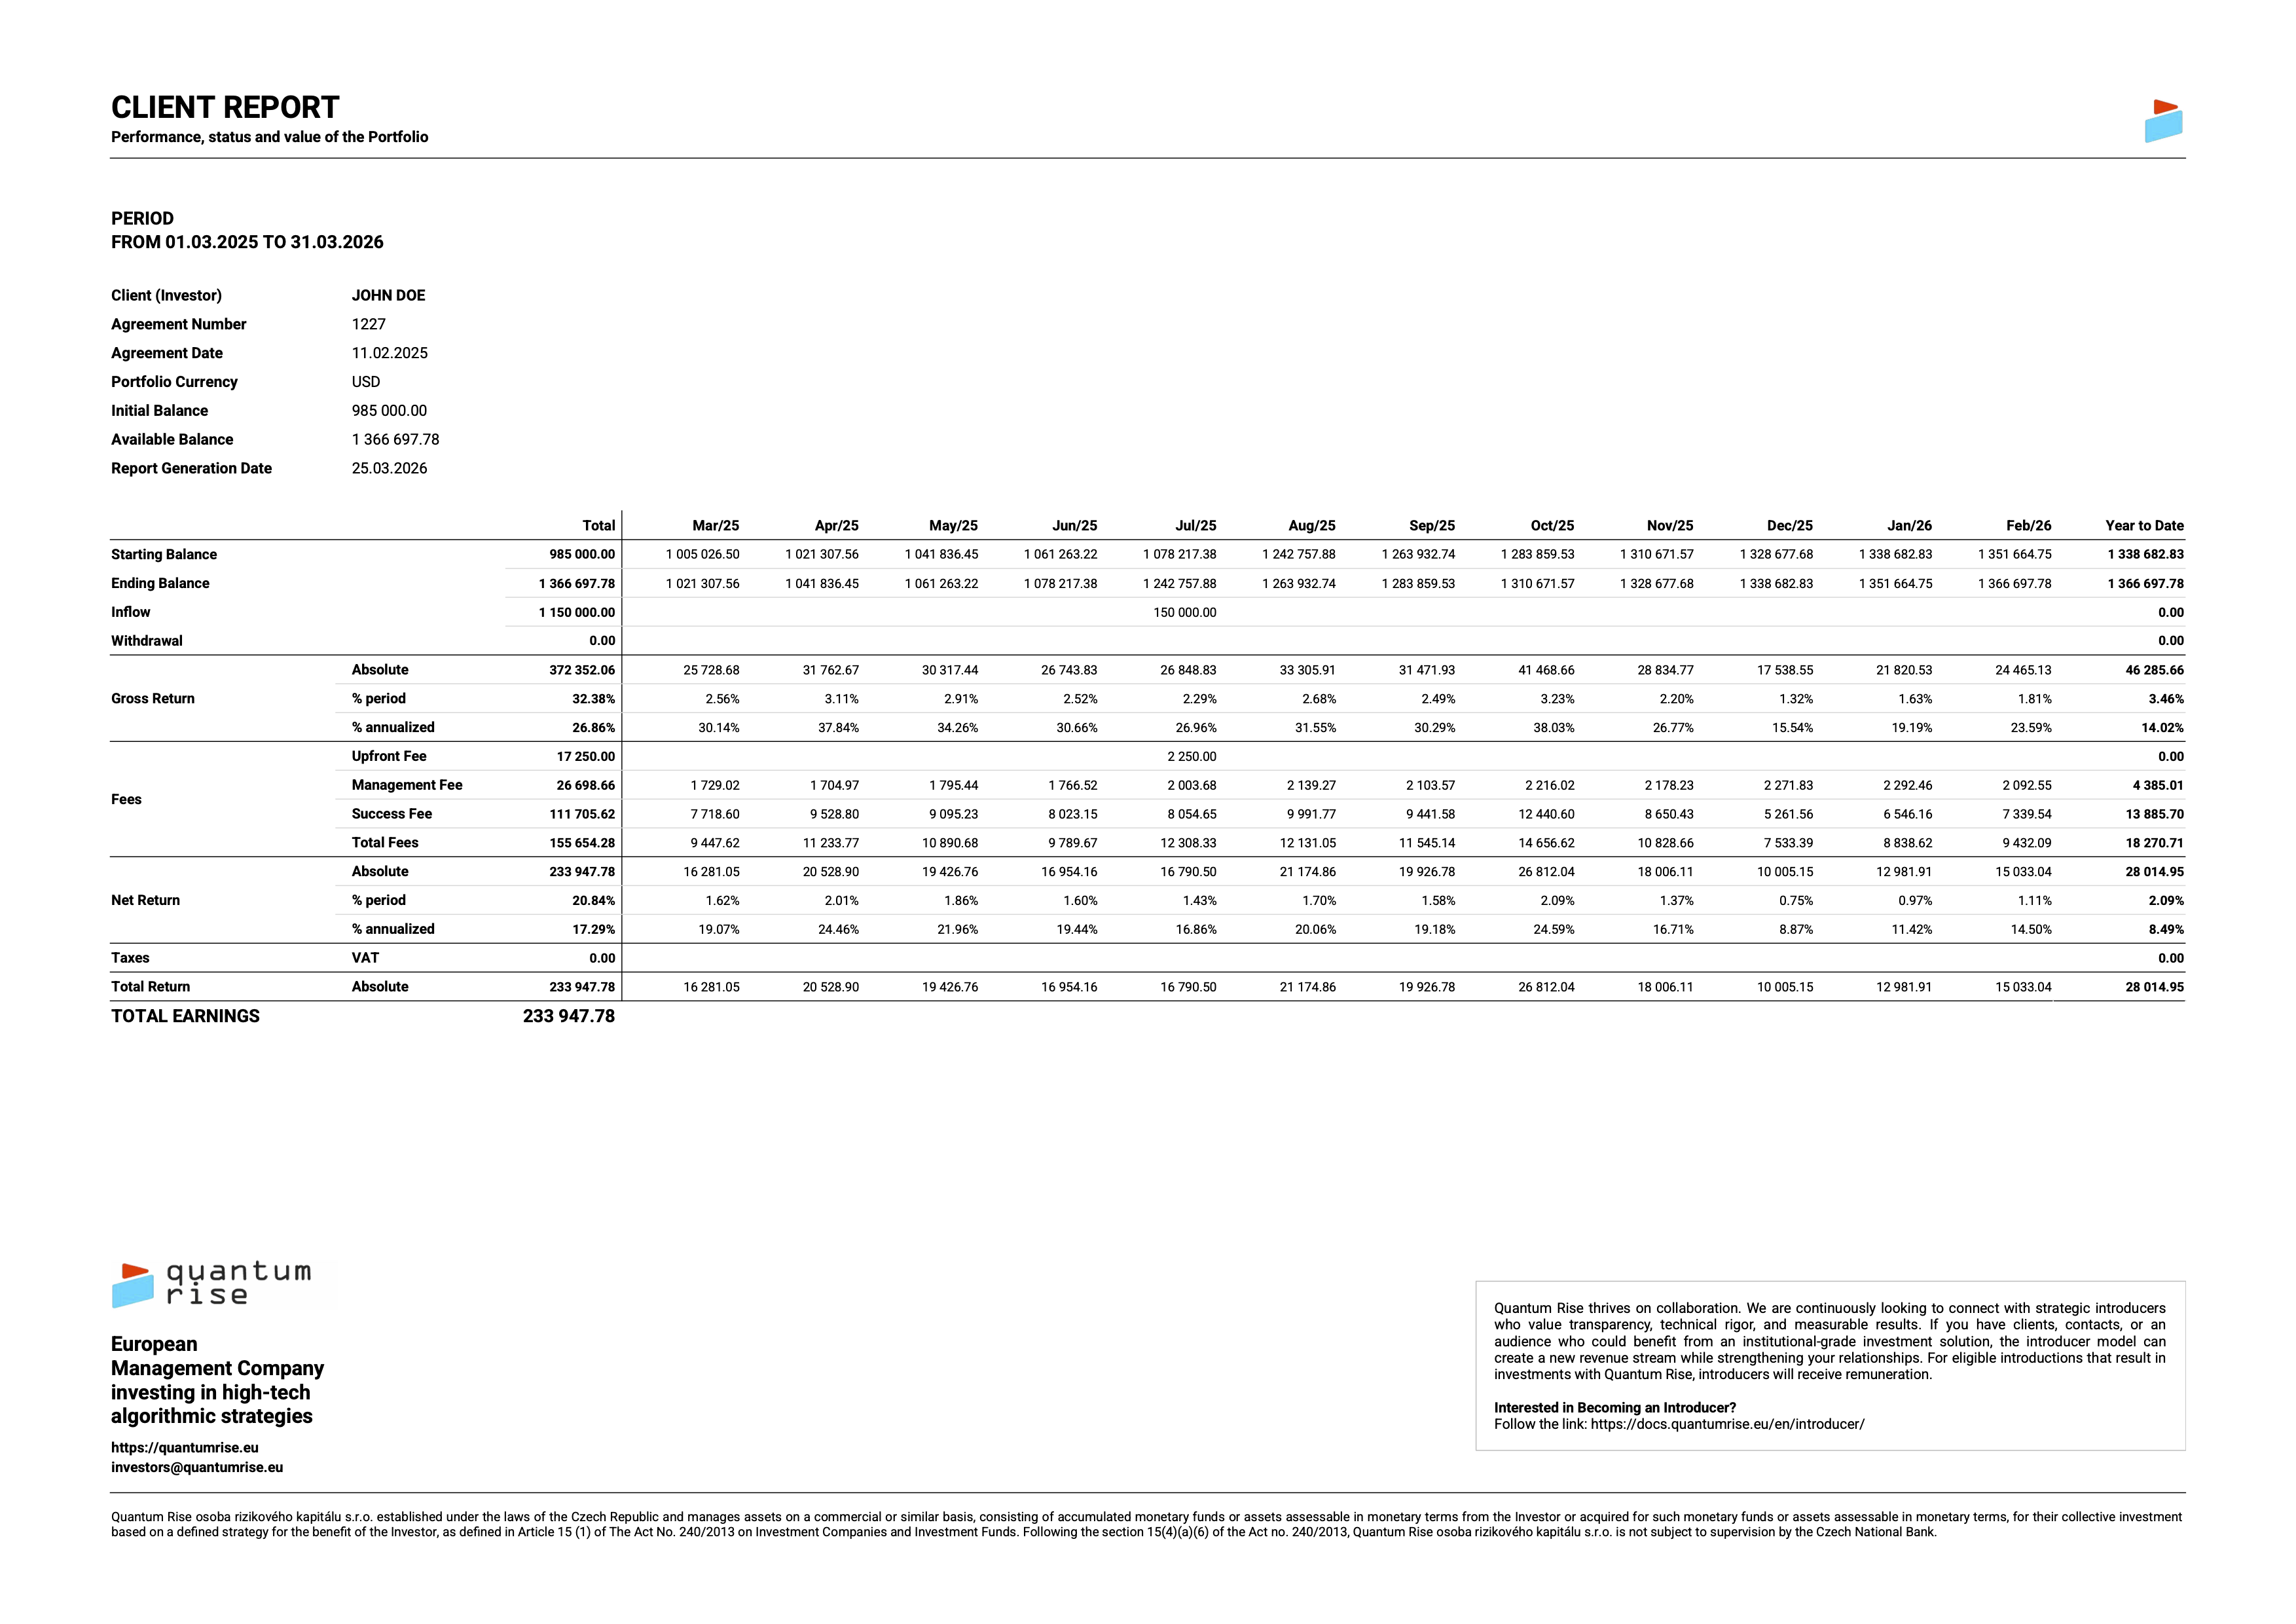
Report basics — identifies the investor, the period, and the currency. The initial balance is the money put in at the start; the available balance is what the portfolio is worth today.
Starting & ending balance — shows the portfolio value at the beginning and end of each month, letting you track growth month by month.
Inflow & withdrawal — records capital movements. In this case $1,000,000 was deposited initially, with a $150,000 top-up later, and no withdrawals were made.
Gross return — the total gains from trading before any fees are taken out, shown both in dollars and as a percentage (monthly and annualized).
Fees — there are three types: an upfront fee on deposits, a monthly management fee for running the portfolio, and a success fee paid only when the portfolio profits.
Net return — the investor’s actual earnings after all fees — the most important number for an investor to focus on.
Total earnings — the bottom-line profit over the full period: $233,947.78 on an initial investment within a year.